Every Sunday I do a Threads review. I look at what performed, what flopped, and what I'll double down on next week. For a long time this meant opening five different tabs, copying numbers into a spreadsheet, and trying to spot patterns myself. Tedious work that I skipped more weeks than I'd like to admit.
Now I run the whole review from a single Claude conversation. Claude pulls the data, builds me a custom HTML dashboard, and proposes three content pillars for the week ahead. Takes about 5 minutes.
This is Post 4, the final post in the BlackTwist MCP Server series. Post 1 covered setup. Post 2 covered weekly content planning. Post 3 covered automated follow-up replies. Today, we close the loop with a data-driven review.
Try BlackTwist for free
4,000+ creators and small companies use BlackTwist to grow their audiences every month- Why Weekly Reviews Matter
- The Analytics Tools Claude Has Access To
- The Prompt That Runs The Whole Review
- Step 1: Claude Pulls the Data
- Step 2: Claude Builds the Dashboard
- Step 3: Claude Proposes Content Pillars
- Workflow Variations
- The Part Where Claude Gets Smarter Than You
- Common Questions
- Wrapping Up The Series
Why Weekly Reviews Matter
Consistency beats complexity. You've heard that. But consistency without feedback is just stubbornness. You need to know if what you're doing is working so you can adjust.
A weekly review answers four questions.
What performed best and why.
What performed worst and why.
Is my audience growing.
What should I do more of next week.
If you can answer those four questions every week, your growth compounds. If you can't, you're running on hope. Hope is not a strategy.
The problem is that most creators don't run weekly reviews because the data is scattered. Per post analytics in one place. Follower growth in another. Engagement rates somewhere else. Building a clean picture takes time most people don't have on a Sunday.
The BlackTwist MCP Server fixes this. Claude pulls all the data in one conversation and presents it as a single dashboard. You read the dashboard, you understand the week, you plan the next one.
The Analytics Tools Claude Has Access To
Before the prompt, here are the tools Claude uses in this workflow.
get_live_metrics returns your current aggregate metrics. Views, likes, replies, reposts, quotes, engagement rate for a configurable time period. Claude uses this for headline numbers.
get_metric_timeseries returns a specific metric broken down by day. Useful for spotting trends. Did engagement climb through the week, or did it spike on one day?
get_post_analytics returns engagement data for individual posts. This is how Claude identifies your top performers and your flops.
get_follower_growth returns your follower count over time. Did you grow last week? Lose followers? Break your personal record?
get_consistency returns your posting consistency data. How many days did you post? Longest streak?
get_daily_recap returns yesterday's numbers in a condensed format. Useful for a morning check in that isn't a full weekly review.
Claude uses all of these in the weekly review. You don't need to remember the tool names. Just know that the data exists, and Claude can grab it.
The Prompt That Runs The Whole Review
Paste this into a new Claude conversation with the BlackTwist MCP connected.
Run my weekly Threads review. Pull the last 7 days from BlackTwist:
Live metrics for the week compared to the previous 7 days
My top 5 performing posts
My bottom 3 performing posts
Follower growth day by day
Daily engagement rate over the last 14 days
Personalized recommendations from BlackTwist
Then build a visual dashboard as an HTML artifact summarizing the week. Use a clean minimal design. Show the key numbers at the top, the top and bottom posts in a table, the follower growth as a line chart, and the engagement rate as a bar chart.
Finally, based on what performed best this week, propose 3 content pillars I should double down on next week. For each pillar, give me the pillar name, why it worked this week, and 3 specific post ideas I can write.
Claude will work through this step by step. Here's what happens.
Step 1: Claude Pulls the Data
Claude calls the BlackTwist MCP tools one after another. You'll see each tool call in the conversation as it happens.
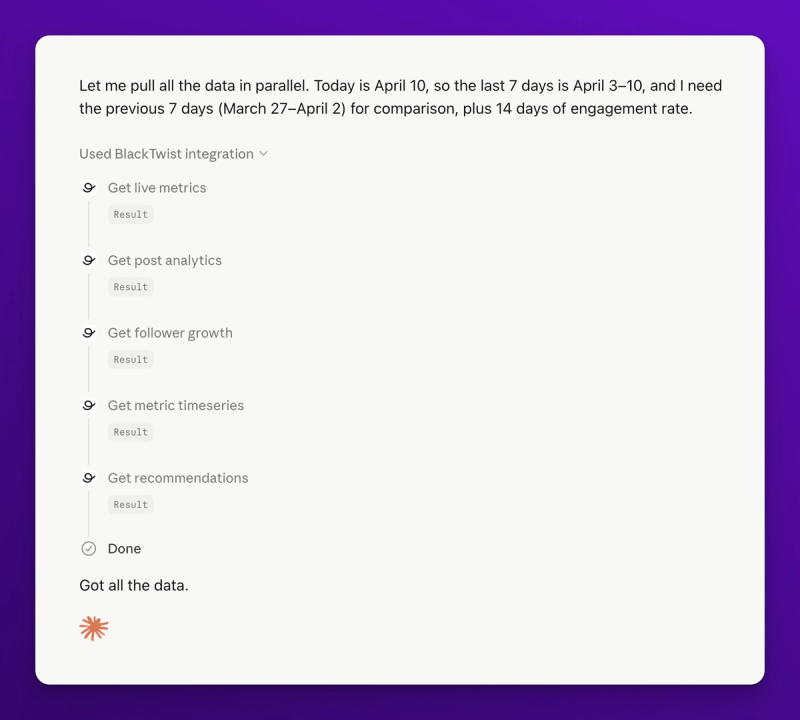
Live metrics first. Then the top posts, bottom posts, follower growth, engagement rate timeseries, and recommendations. Each tool returns structured data that Claude reads and summarizes inline.
This step alone saves 15 minutes. Opening the dashboard, copying numbers, comparing tabs. Done in 30 seconds.
Step 2: Claude Builds the Dashboard
Here's where it gets fun. Claude takes all the data and builds a visual dashboard. You see the dashboard in real time as Claude builds it.
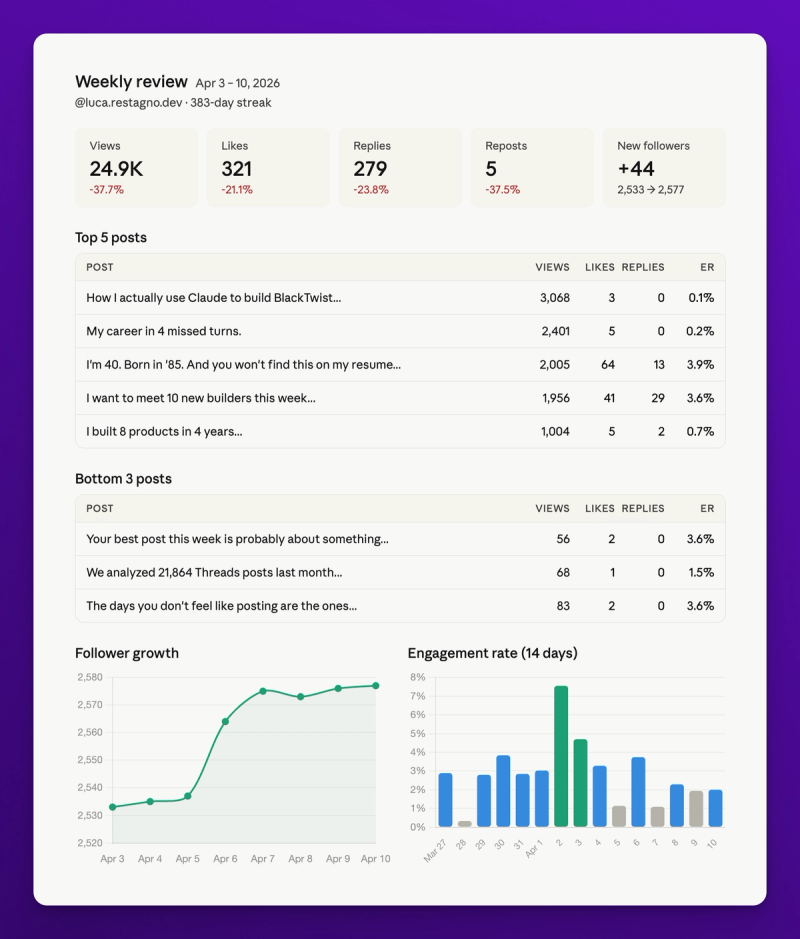
The dashboard has four sections.
Headline metrics at the top. Total views this week, total engagement, follower change, engagement rate. Each one shows the week over week change as a percentage.
Top and bottom posts. Two tables side by side. Top 5 shows what worked. Bottom 3 shows what didn't. Each post has its text, views, likes, and replies.
Follower growth chart. Day by day line chart for the week. You see the shape of your growth.
Engagement rate chart. Bar chart showing engagement rate per day for the last 14 days. You see the rhythm and spot dips.
The dashboard is built on the fly for your specific data. No templates. No static reports. Just a visualization of your actual week.
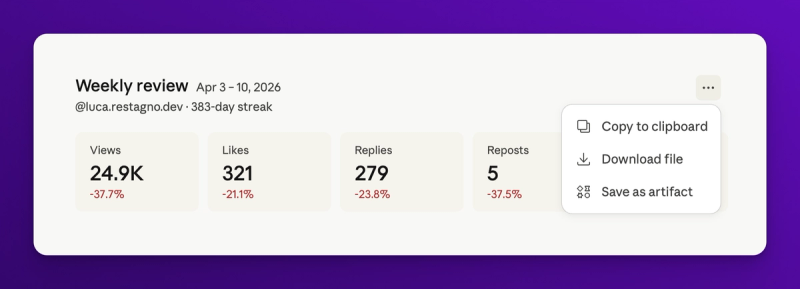
You can export the dashboard as HTML or take a screenshot for your records. Some people save these week over week to build a visual history of their growth.
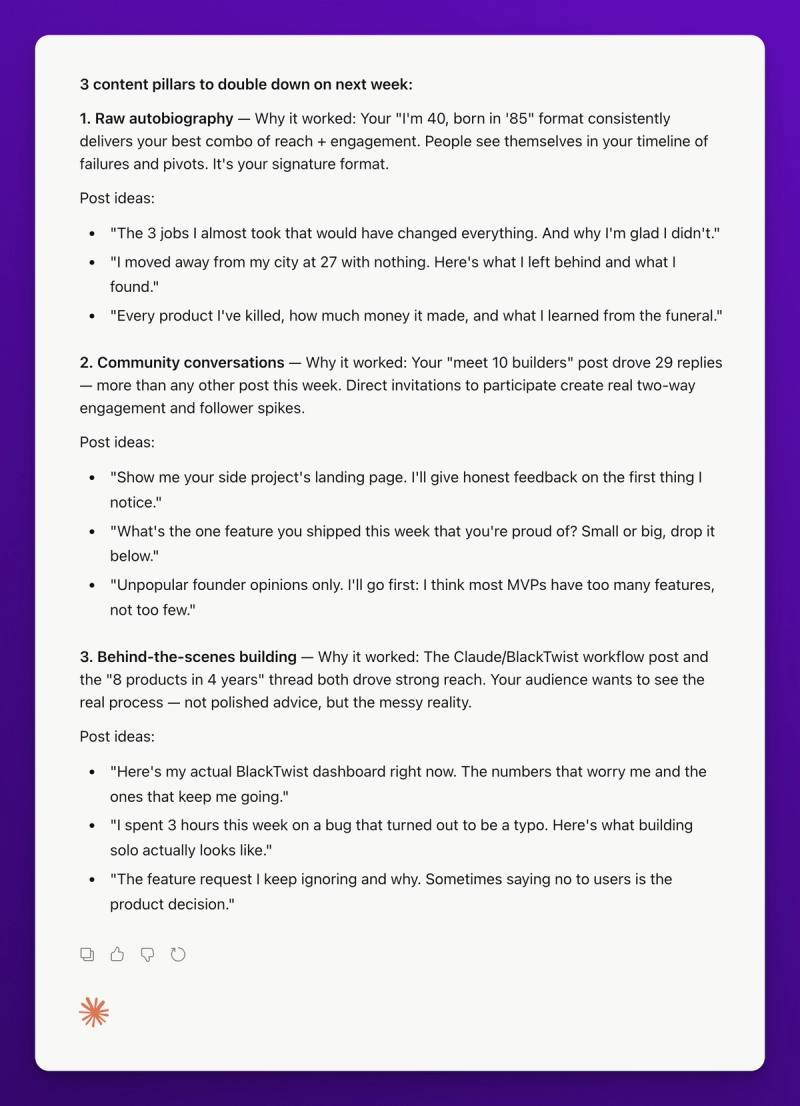
Step 3: Claude Proposes Content Pillars
The dashboard tells you what happened. Content pillars tell you what to do next.
After building the dashboard, Claude reads the data again and writes three pillar recommendations. Each pillar has a name, a reason it worked, and 3 specific post ideas.
Here's an example output from a real review I ran last week.
Pillar 1: The Consistency Floor Framework
Why it worked this week: Your top post was about how daily posting feels different when you treat it as a floor instead of a ceiling. It got 847 views and 62 replies, your highest reply count of the week. The phrase "consistency floor" resonated because it reframes a hard habit as something achievable.
Post ideas:
- A before and after of what your calendar looked like before and after you adopted the consistency floor mindset
- The exact minimum threshold you use (1 post per day? 3 posts per day?) and how you picked it
- What happens on days when you can't even hit the floor (spoiler: you don't burn the streak)
Claude gives you three of these. Nine post ideas total. You take the best ones, feed them back into the weekly planning workflow from Post 2, and your content is set for the week.
This is the loop. Data in, pillars out, new content written, published, measured, back into the dashboard next week. Each cycle makes your content sharper because you're always writing toward what your audience actually responds to.
Workflow Variations
The full review prompt above is the deluxe version. Here are a few lighter variations you can run on different days.
Morning check in (2 minutes)
Give me yesterday's recap. New followers, posts published, best post of the day.
Claude calls get_daily_recap and summarizes in a few sentences. No dashboard. Just a pulse check.
Mid week temperature read (5 minutes)
Compare this week so far to last week at the same point. Am I on track to beat last week? If not, what do I need to change?
Claude pulls partial week data, compares against the same day last week, and gives you a focused answer.
Monthly deep dive (10 minutes)
Run my monthly review. Last 30 days vs the 30 days before. Top 10 posts. Follower growth trend. Best posting times. What should I change for next month?
Claude pulls a month of data, identifies bigger patterns, and recommends strategic changes instead of tactical ones.
Post specific postmortem (3 minutes)
My Tuesday morning post got 200 more views than my average. Pull the post, pull the data, and tell me what made it different from my usual content.
Claude finds the post, pulls its analytics, compares it to your baseline, and hypothesizes what made it work.
You can run these at different cadences. Morning check in daily. Temperature read mid week. Full review weekly. Deep dive monthly. Postmortem whenever something interesting happens.
The Part Where Claude Gets Smarter Than You
Here's a moment from last week's review that surprised me.
Claude pulled my data and noticed that my engagement rate was climbing Monday through Wednesday, then dropping sharply Thursday through Sunday. I hadn't spotted the pattern because I was looking at weekly aggregates. Claude saw it because get_metric_timeseries breaks the data down by day.
It asked: "Are you publishing different types of content early vs late in the week?"
I checked. Monday to Wednesday I was publishing personal stories. Thursday to Sunday I was publishing how to content. The personal stories were outperforming the how to content by 2x on engagement rate.
That's a finding I would have missed. I've been running this account for two years. Claude spotted it in a single conversation because it was reading the data fresh and pattern matching against the rest of the week.
The lesson: let Claude interrogate your data. Don't just ask for a summary. Ask why. "Why did Tuesday outperform Thursday?" "Why did this post get more replies than my usual?" "What do my top 10 posts have in common that my bottom 10 don't?"
Claude will give you answers based on your actual numbers, not generic creator advice from a podcast.
Common Questions
Does the dashboard update automatically? No. The dashboard is a snapshot of the data at the moment Claude built it. Run the review again next week to get a fresh dashboard.
Can I save the dashboard? Yes. Claude lets you export the artifact as HTML. You can also screenshot it. Some people build a folder of week over week dashboards as a visual history.
Which plan do I need for the full analytics? Check your BlackTwist plan. Basic metrics (live_metrics, daily_recap) are on all plans. Advanced analytics (time series, post level analytics, recommendations) typically require a paid plan. If a tool fails, your plan is probably the reason.
Can Claude compare me to other creators? Not directly. BlackTwist doesn't expose other creators' data through the BlackTwist MCP Server. But Claude can use the BlackTwist monthly Threads report data (based on 20K+ posts from 255+ creators) as a reference if you ask it to. "Compare my engagement rate to the average in the Threads creator community."
What's the best day to run the weekly review? I do it Sunday evening. Gives me a clear plan for the week ahead. Some people do it Monday morning to start the week fresh. Pick whichever fits your workflow and stick with it.
Can I run this review on a schedule? Yes. Claude now supports scheduled tasks, so you can ask Claude to run this review automatically every Sunday and drop the dashboard into a new conversation each week. You can also connect Gmail, Slack, and other apps to Claude, which means the weekly report can land directly in your inbox or as a message in your Slack channel of choice.
Wrapping Up The Series
Four posts. One workflow.
Post 1: Connect Claude to BlackTwist and schedule a post through a conversation.
Post 2: Plan and schedule a full week in one sitting with your time slot format.
Post 3: Set up automated follow up replies so your best posts drive traffic while you sleep.
Post 4: Run a weekly review, build a custom dashboard, and let Claude propose pillars based on what actually worked.
Put them together and you have a complete Threads operating system. Planning, publishing, automating, measuring, iterating. All from Claude. All connected to your real data. All built on top of a content habit you already have.
The point isn't that automation replaces the work. The point is that automation removes the friction around the work so you can spend more time on the part that matters: writing things worth reading.
If you haven't connected the BlackTwist MCP Server to Claude yet, here's one more nudge: blacktwist.app/mcp/docs. Free on all plans. Setup takes 30 seconds. You can have your first automated Threads workflow running before the end of your coffee.
See you in the next one.